Stock to Flow Model
Stock to Flow model is a methodology that explains why scarce commodities retain their value through time.
Stock: Already existing amount of the commodity.
Flow: Yearly production amount of the commodity.
S/F: Stock to Flow ratio.
Stock to Flow ratio gives us how many years are needed to produce the total amount of a commodity which already exists. Assume the whole mined or produced amount of a commodity suddenly disappears; how many years will it take us to reproduce it? When the S/F ratio is high, this is a clear indicator for scarcity of that commodity. On the other hand if total stock of a commodity is easy or more importantly fast to reproduce, that commodity isn’t considered to be scarce.
Stock to Flow Ratio of Gold
Gold is considered to be one of the most scarce and valuable commodities, therefore it is a good example for stock to flow ratio. The amount of gold already mined can not be known exactly but it is estimated to be around 198,000 tons. Yearly production of gold is around 3,000 tons. When we put these values into the equation,
Stock of Gold: 198,000 tons
Flow of Gold: 3,000 tons
S/F of Gold: About 66 years
This means that if all the gold which has already been mined disappears, with today’s production capacity, we need about 66 years to re-mine the same amount of gold. This value is quite high, therefore it is an indication that gold is a scarce commodity.
Stock to Flow Ratio of Bitcoin
Bitcoin, the first cryptocurrency with the highest network effect, having one of the highest liquidity and volume, is worth examining under the stock to flow model. At the time of the halving on 11th May 2020;
Stock of Bitcoin: About 18,300,000 Bitcoins were already mined
Flow of Bitcoin: Dropped to about 330,000 Bitcoins per year
S/F of Bitcoin: About 55 years
So, with the halving on 11th May 2020, Bitcoin’s stock to flow ratio became very close to Gold. With the next halving expected in 2024, Bitcoin’s S/F will become about 120 years and this will make Bitcoin the most scarce commodity ever.
It is also worth noting that Bitcoin’s flow will never increase due to demand, which is a certain differentiation from Gold and any other commodity.
Production Cost
All commodities have a production cost which varies by region and technologies being used. From now on, when we mention production cost, we will refer to worldwide average production cost.
When the market price of a commodity drops below the production cost, miners will stop producing as they will be in a non-profitable situation. As a result, there won’t be any more flow into the market at lower prices than production cost. Assuming there is always some demand in the market, removal of supply pushes prices up, or at least slows down the price drop.
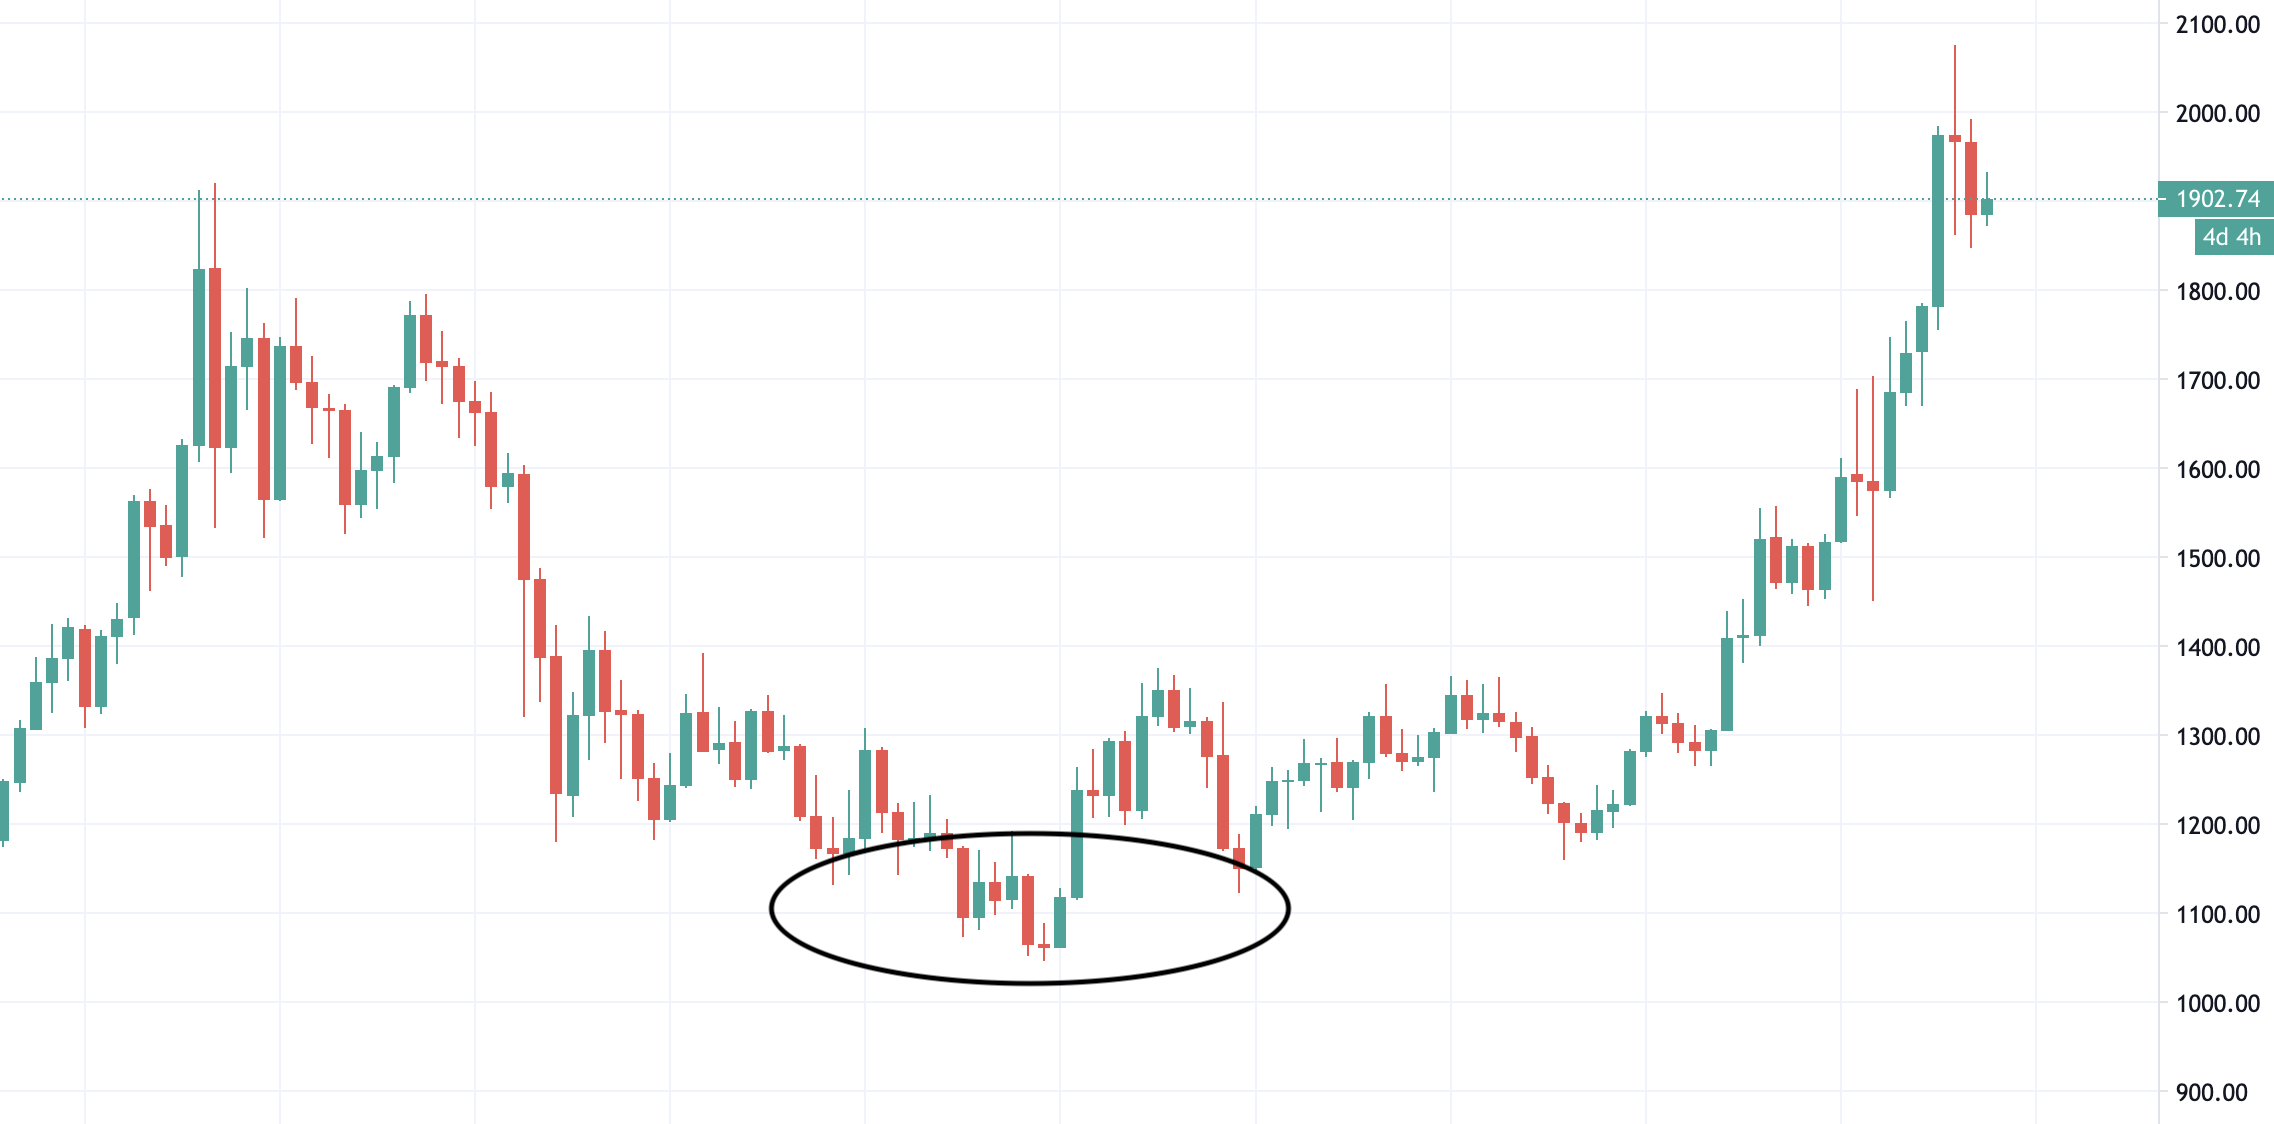
Production Cost of Gold
During the commodity crash between 2013-2016, it was known that the average mining cost of Gold was around 1,100 USD / Oz. When Gold prices dropped to this area, many miners stopped operations and Gold price couldn’t go lower, which created the bottom of the market.
Production Cost of Bitcoin
During the last bear market, Bitcoin prices bottomed around 3,100 - 3,200 USD area. It is well known that this area was the cost of producing Bitcoin in China where a significant amount of Bitcoin miners are operating.
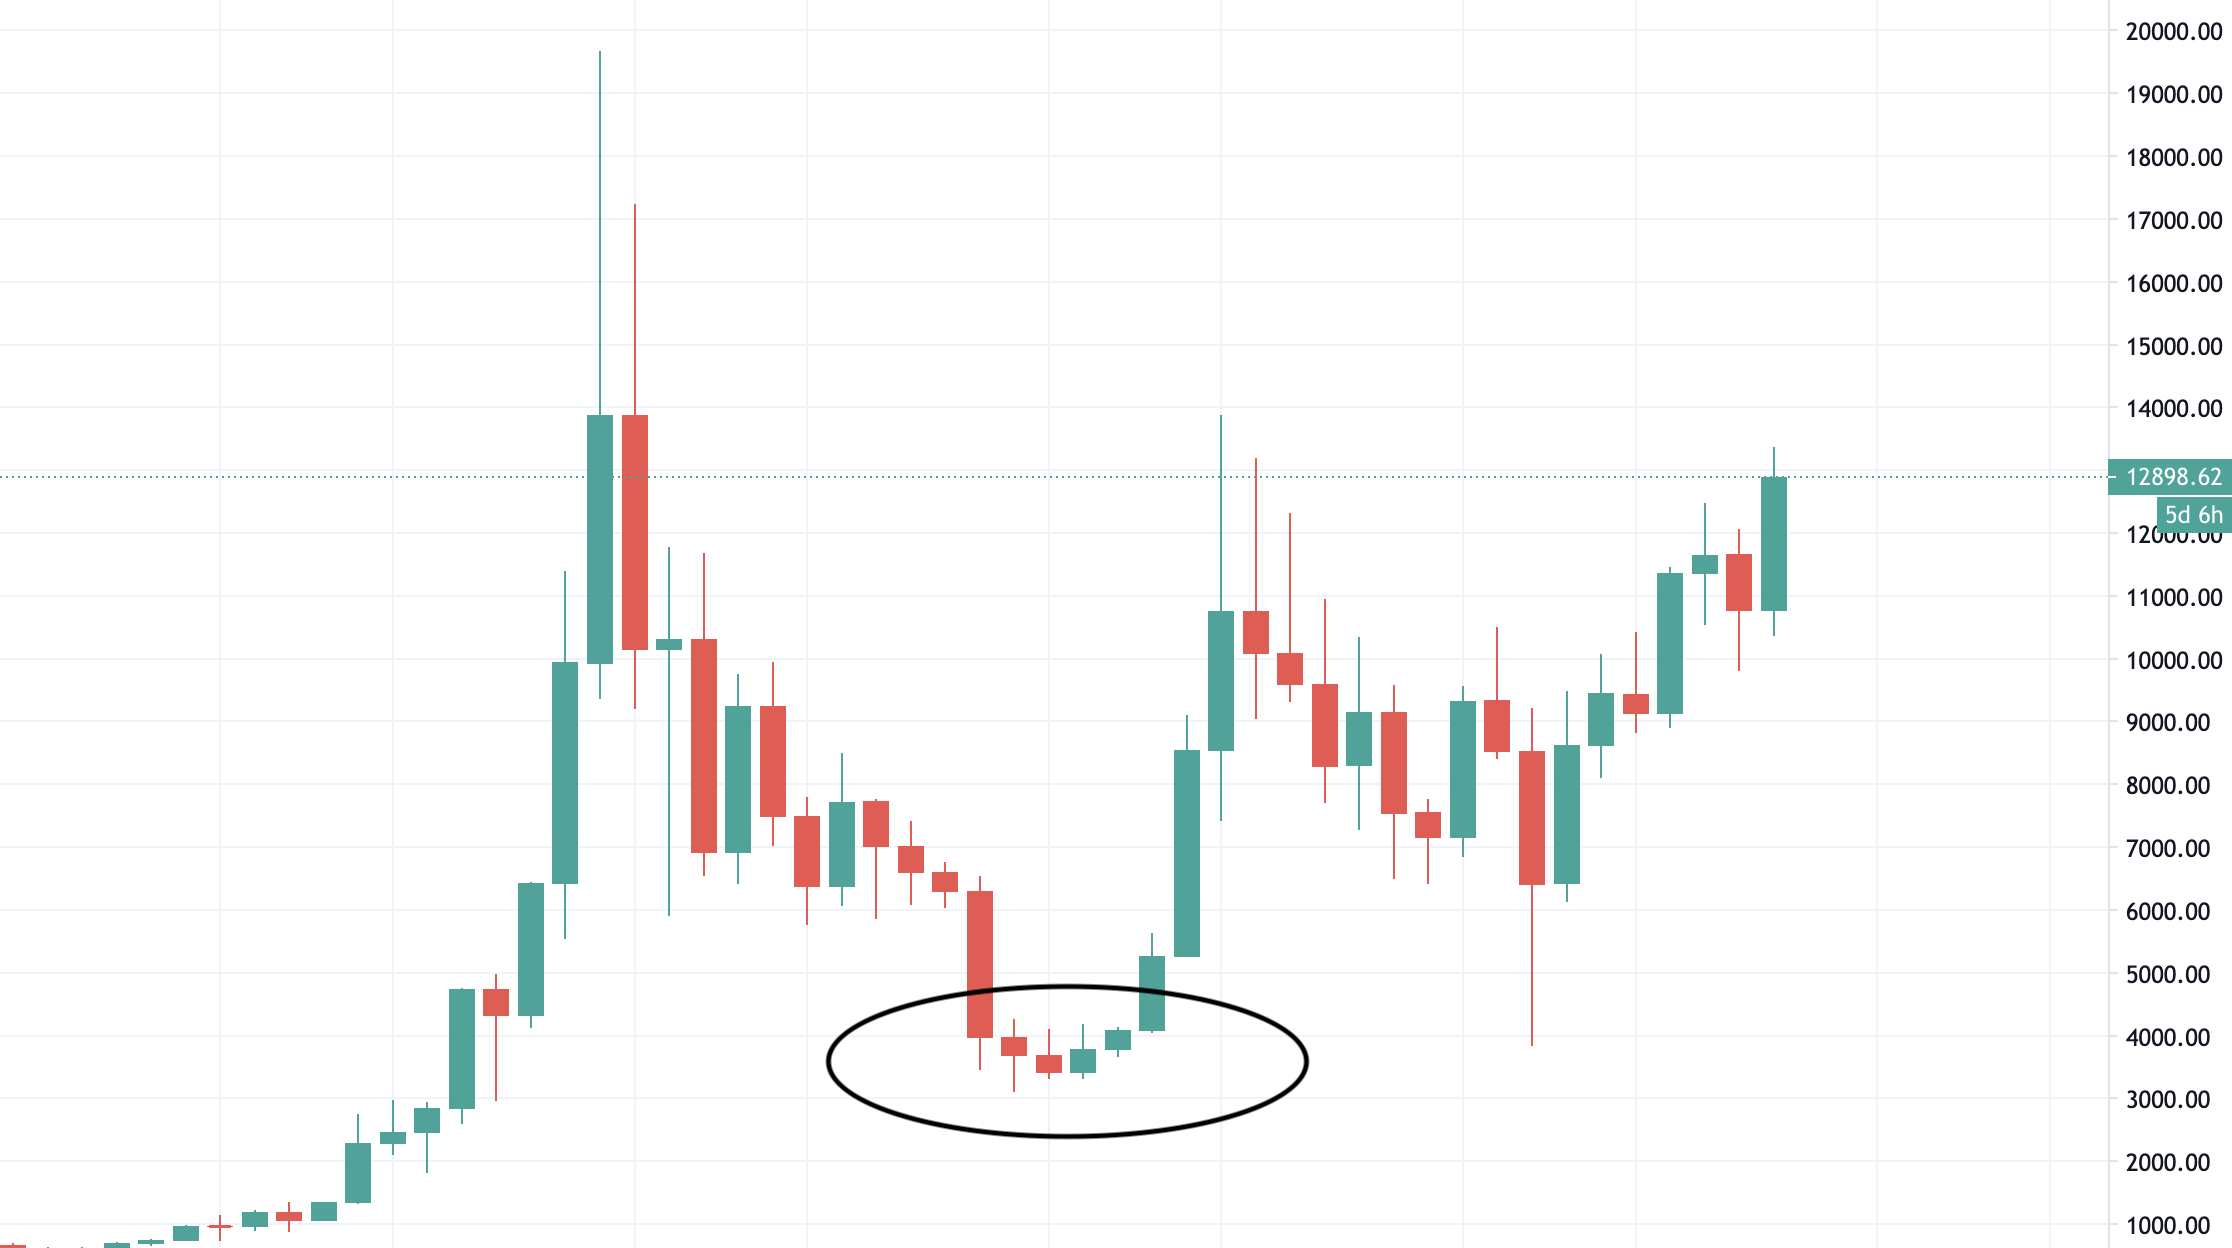
We can conclude that in most cases, production cost creates a clear bottom in the markets.